 Thanks to always improving DNA sequencing technologies, biologists now have access to the full genome sequences for dozens of plants and animals. In addition, many individuals now have access to their own personal genome sequences. To understand all this, we need user-friendly software that translates esoteric strings of DNA letters into interactive images we can easily explore and understand.
 To meet this need, we develop Integrated Genome Browser (IGB), a fast, flexible, and free graphical user interface for visualizing and understanding genome sequence data.
IGB is a desktop software program you download from our Web site and run on your local computer. Once downloaded, IGB lets you connect to reference genome sequence data from many species. You can open and explore data files from your local desktop computer’s file system.
IGB implements innovative but practical visualization techniques that stimulate insight and lead to new questions, the foundation of scientific progress. The most important of these techniques are: animated zooming and jump-zooming. Animated zooming let’s you sail from chromosome to base pair and back again in a single sweep of the mouse. Jump-zooming lets you teleport from location to location, via a sweeping mouse movement or by double-clicking a search result. A third technique is that IGB focuses zooming on the location of your last click, which helps you keep track of where you’ve been and where you’re going.
 IGB offers many options for building sophisticated, attractive, and informative data visualizations, a feature that is especially important for scientists and educators.
Using the IGB Annotation tab, you can configure colors, add or remove arrows indicating reference strand, add or remove labels, fine-tune track heights, and perform operations on tracks.
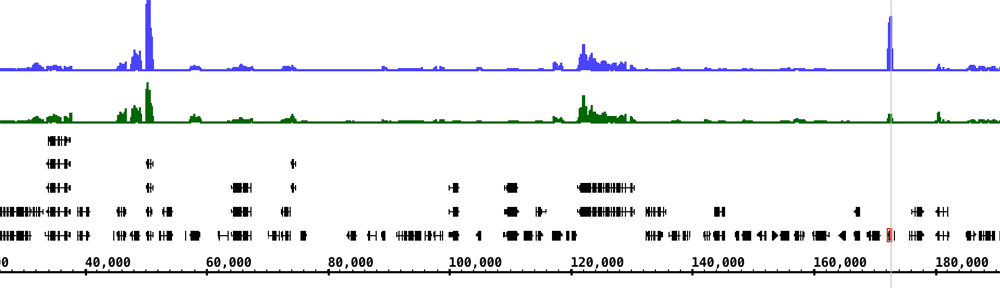
You can filter tracks so that only certain types of data are shown, such as sequence alignments with intron-like gaps. You can also hide, show, or color-code annotations based on their score, which can be especially useful when sifting through quantitative data such as ChIP-Seq peaks. In the image above, we configured IGB to use yellow and magenta for plus and minus strand RNA-Seq reads. We also locked the height of the gene models track.
IGB already has dozens of features, but often scientists need to build specialized visualizations unique to their data or particular research questions. Scientists are constantly thinking of new questions, and there is no way anyone could ever predict every feature scientists will need! For this reason, we designed IGB to be a platform, not just an application. Our idea is that developers working closely with scientists can add new functionality to IGB as plug-ins called IGB Apps. Developers can distribute their Apps to the community using the IGB App Store.
Links:
- IGB download site: https://bioviz.org
- Example IGB Apps: https://bitbucket.org/account/user/lorainelab/projects/IAQ
- IGB App Store: https://apps.bioviz.org